Site Visitor Statistics
2024
The following Google Analytics graph shows the trend line for site visitors totaling approximately 202,000 with 153,000 first time visits. While traffic fluctuates month-to-month with traditional dips in summer months, the simple average is 16,000 per month up slightly from 2023. There were 383 new properties subscribed in 2024, representing 19% of the 1,574 total properties listed, both showing and hidden (occupied).
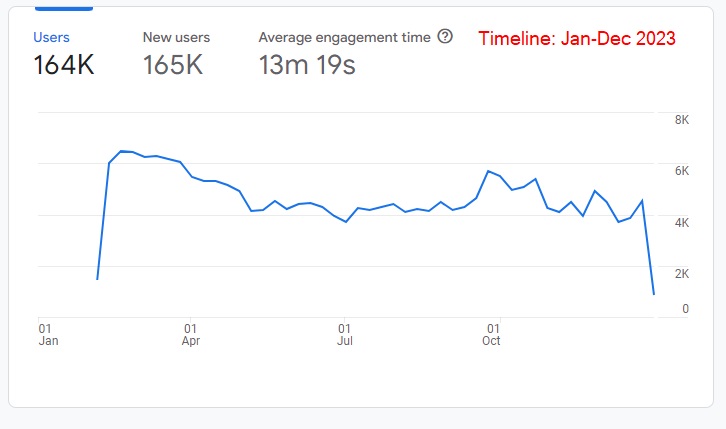
2023
The following Google Analytics graph shows the trend line for new visitors totaling approximately 164,000. These are reportedly unique first-time visitors averaging 13,000 per month and is in line with the past several years. There were 504 new properties subscribed in 2023, representing 33% of the 1,551 total subscribed units.
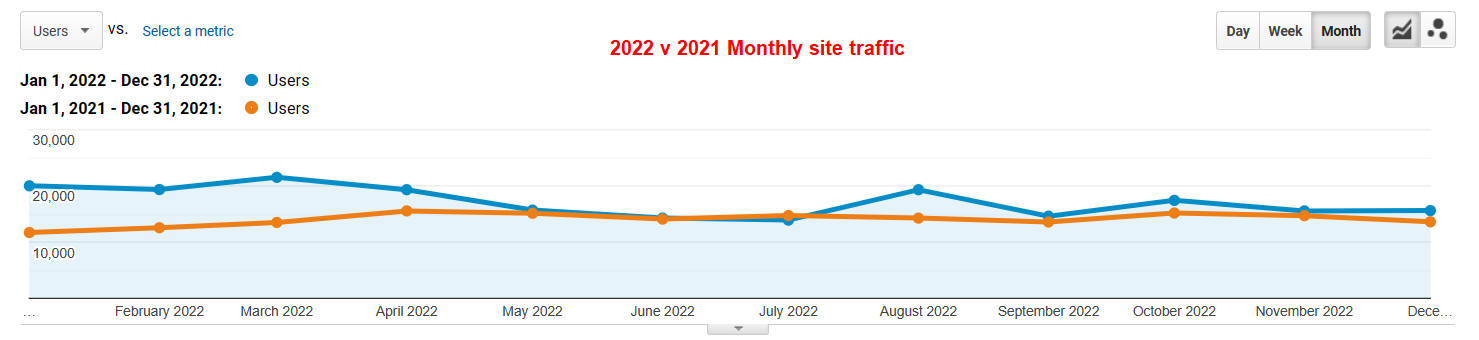
2021 & 2022
We have switched to Google Analytics to monitor site traffic, which uses different metrics from our past analytics provider. The trend line indicates a slight increase in site traffic in 2022 compared to 2021. There were 515 newly subscriber properties added in 2022 representing 38% of all advertisements. This is in line with the annual trends over the last several years.
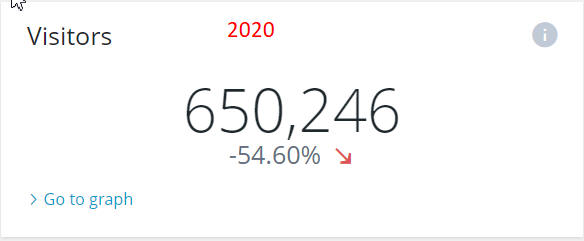
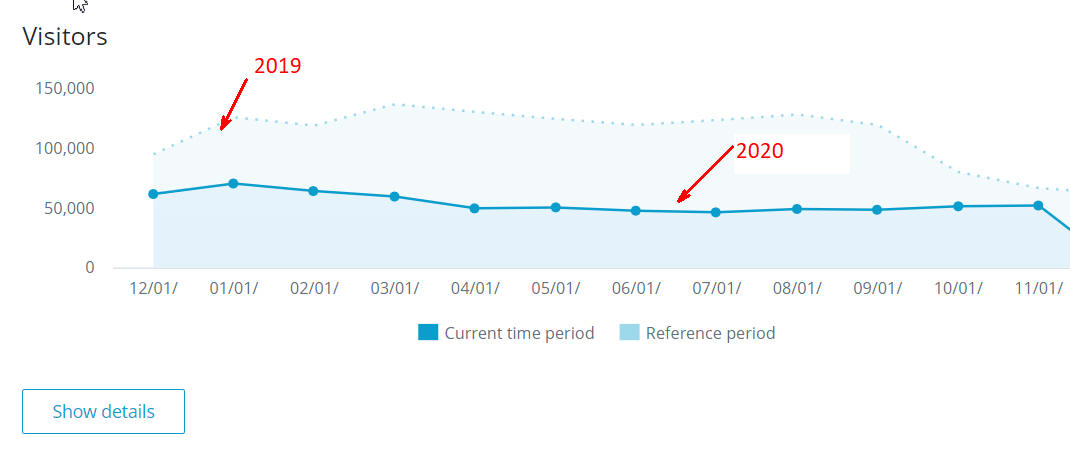
2020
The following graphs show traffic to the site from January - November 2020 (we moved the site to a new host at the end of November and stats are not yet available). There was a clear decline in the visits to the site, which can be directly attributed to the COVID-19 pandemic, which impacted travel worldwide with border closings, travel bans, business lock-downs and quarantine requirements that plagued us throughout most of the year.
There were 548 first-time listings to the service accounting for 34% of our current advertisements. 66% of which are multi-year renewals, which is a stable trend over the last 8 years.
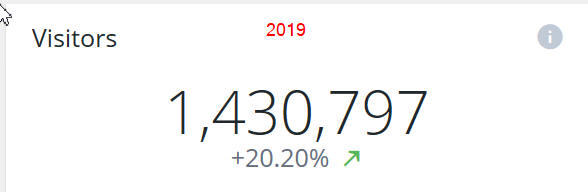
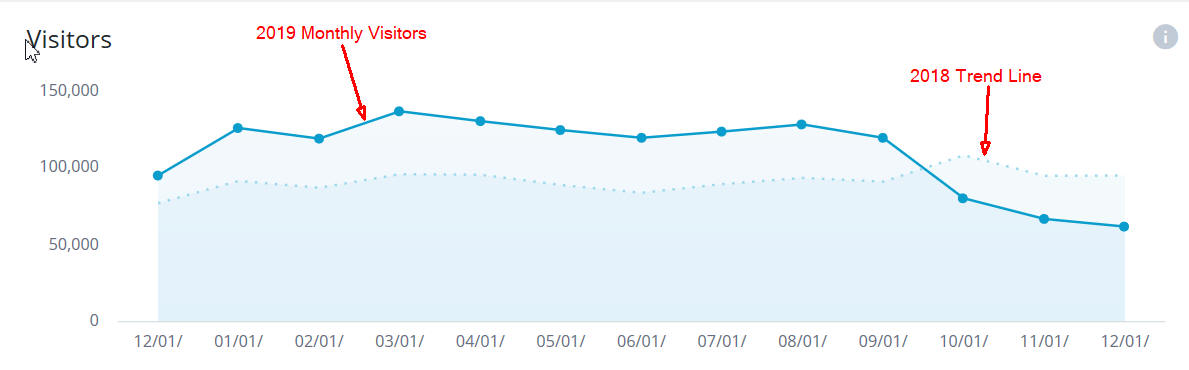
2019
The following graphs show a steady trend of increased in site visits. There were 523 first-time listings accounting for 34% of our current advertisements. 66% are repeat subscribers, which is a stable trend orver the last 6 or 7 years.
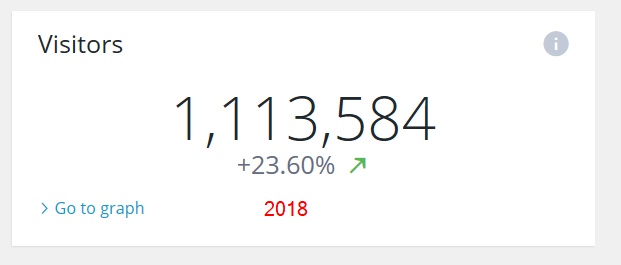
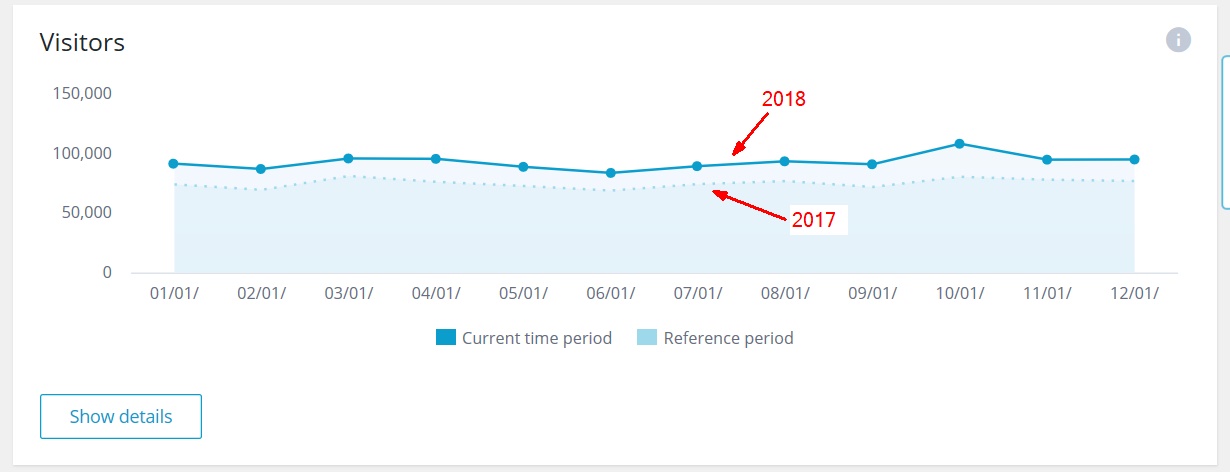
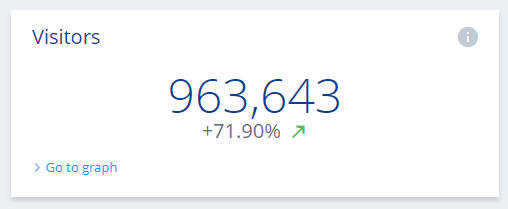
2018
The following graphs show a steady trend in increased in traffic in 2018 over 2017. While owner access is counted, owners represent only about 15% of the site traffic.
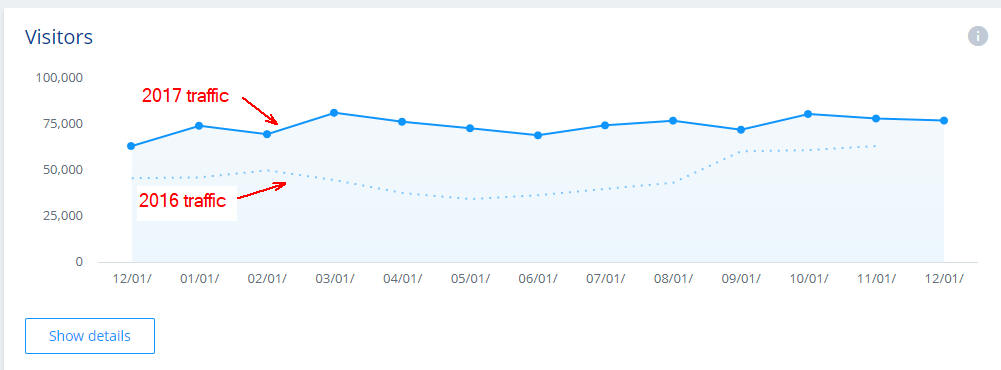
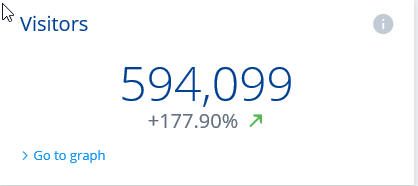
2017
The following graphs show a strong increase in traffic in 2017. In part this could be attributed to the launch of our redesigned mobile-friendly website in August, which enables mobile browsers to more easily find the website using search engines.
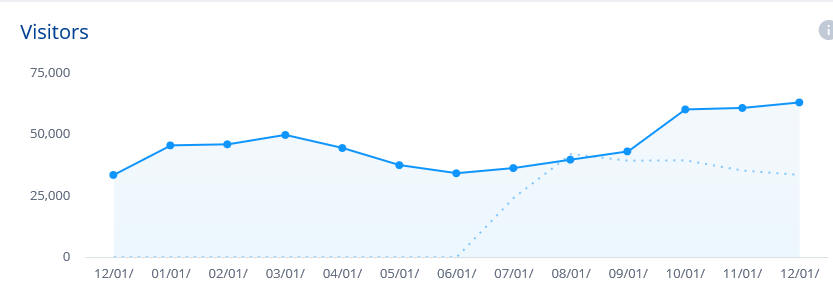
2016
It appears that our 2016 site traffic has taken a nose-dive since 2015 when looking at the visitors numbers; However, the graph clearly indicates an upward trend in visitors based on the dotted line representing 2015 traffic. We believe this is due to a change in the algorithm that tracks web traffic. Which numbers are correct and which are not? We don't know. But the true value is in the renter inquiries, which are strong and range from 100-300 email inquiries per day.
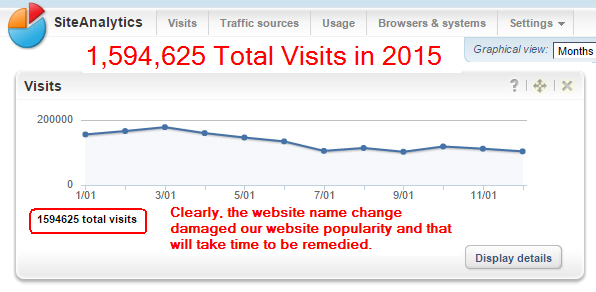
2015
Due to a trademark issue we were forced to change the website name of our business in June. That caused confusion for renters who had used the website in earlier years. We expect time and our vigorous efforts will remedy the issue. We thank you for your patience.
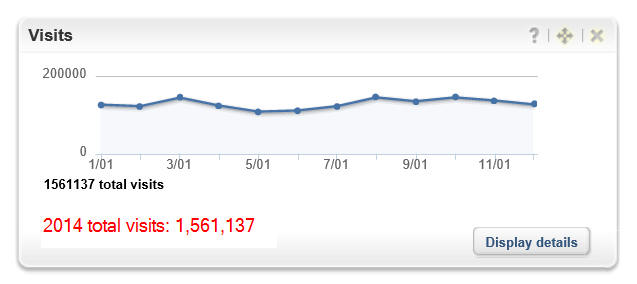
2014
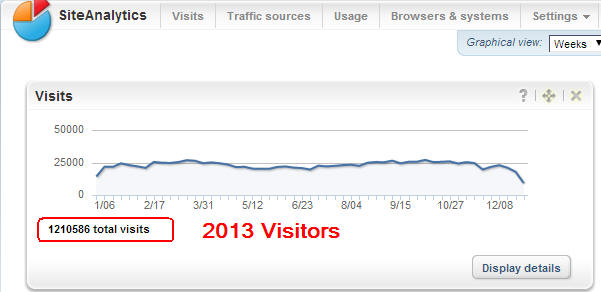
2013
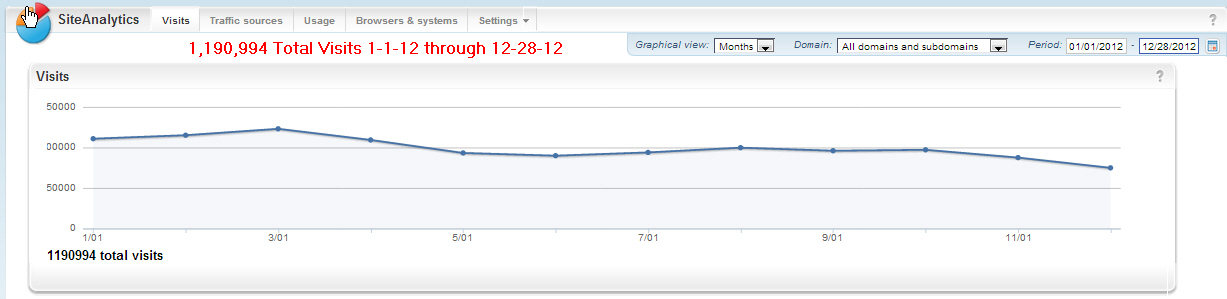
2012
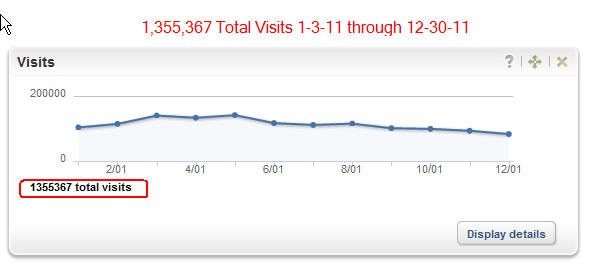
2011